Measuring PM-noise using a PLL
The Quadrature Mixing or PLL method is used in some form in most commercial phase-noise test equipment today. The reason for this is obvious. This method is very flexible. It can measure phase noise at a very wide range of measurement frequencies, only limited by the specs of the mixer and the availability of a clean reference oscillator. It allows to measure very close-in such as 10Hz! Furthermore it suppresses AM-noise and only measures PM-noise, which is usually what is needed. But how does it work and how does it suppress AM-noise?
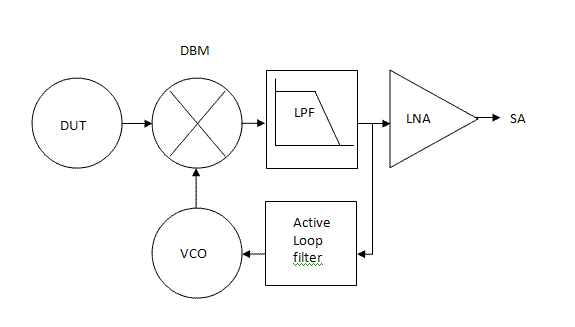
The above picture shows the block diagram of the single channel version of this method. The DUT is mixed down to the baseband with a double balanced mixer. At the same time the DBM is also used as the phase detector. I have used an SRA-1H+ commutating mixer that can be modeled as a a multiplier. When the system is in quadrature lock, and normalizing the DBM input signals to 1 for simplicity, then the IF-port signal of the DBM is shown by the following expression in the time domain, where A(t) and φ(t) are the AM and PM-noise components respectively. The 90° phase shifted reference signal is assumed to be ideal without AM or PM-noise in this expression:
IF(t) = ( 1 + A(t) ) ⋅ cos( ωt + φ(t) ) ⋅ cos( ωt + π/2 )
With a bit of cosine math this can be rewritten as:
IF(t) = ( 1 + A(t) ) / 2 ⋅ ( cos( 2ωt + φ(t) + π/2 ) + cos( φ(t) - π/2 ) )
The low pass filter function takes care of the 2ω cosine term so after the LPF the following expression remains:
LPF(t) = ( 1 + A(t) ) / 2 ⋅ cos( φ(t) - π/2 )
Which can be rewritten as:
LPF(t) = ( 1 + A(t) ) / 2 ⋅ sin( φ(t) )
Now it can be easily seen that the DBM is acting as a phase detector and will result in 0V DC output when φ(t) = 0, hence the 90° lock! In case of small angles the expression can be further simplified to:
LPF(t) = ( 1 + A(t) ) / 2 ⋅ φ(t)
This can be rearranged to:
LPF(t) = φ(t) / 2 + A(t)⋅φ(t) / 2
And now we see why the PLL method suppresses AM-noise! When PM-noise and AM-noise are low, then for sure the term A(t).φ(t)/2 becomes very small and is negligible to φ(t) / 2. So with this final approximation in place the output signal becomes:
LPF(t) = φ(t) / 2
This proves that we are measuring the phase noise mixed down to the baseband with a -3dB conversion loss of the idealized DBM modeled as a multiplier.
Measuring AM-noise using a PLL
A slight variation of the PLL method allows for pure AM-noise measurements with good suppression of PM-noise. A different phase detector is needed that causes the PLL to lock at 0°. With a 0° lock, we see the following signal in the time domain at the IF-port of the DBM:
IF(t) = ( 1 + A(t) ) ⋅ cos( ωt + φ(t) ) ⋅ cos( ωt )
Which can be rewritten into:
IF(t) = ( 1 + A(t) ) / 2 ⋅ ( cos( 2ωt + φ(t) ) + cos( φ(t) ) )
The low pass filter function takes care again of the 2ω cosine term so after the LPF the following expression remains:
LPF(t) = ( 1 + A(t) ) / 2 ⋅ cos( φ(t) )
In case of small angles the expression can be further simplified to:
LPF(t) = ( 1 + A(t) ) / 2
Which proves that we are measuring the AM-noise mixed down to the baseband with a -3dB conversion loss of the idealized DBM as a multiplier. However now also a DC component is present!
To measure AM-noise with the PLL method, the DBM cannot be used as the phase detector in this system. A separate phase detector that produces a lock at 0° like a digital EXOR gate phase detector is needed.
Implementation of the PLL method
Not too many homebrew phase noise measurement systems using the PLL method have been described. One worth mentioning however is the paper by Jacob Makhinson, N6NWP, in the spring 1999 edition of Communications Quarterly: '"DEMPHANO", A device for measuring phase noise'. The design that I have build can be found in the Public Domain Library by Charles Wenzel from Wenzel Associates. The following picture shows the entire euro-card sized unit with a few adaptations to meet my needs, inside a metal enclosure:
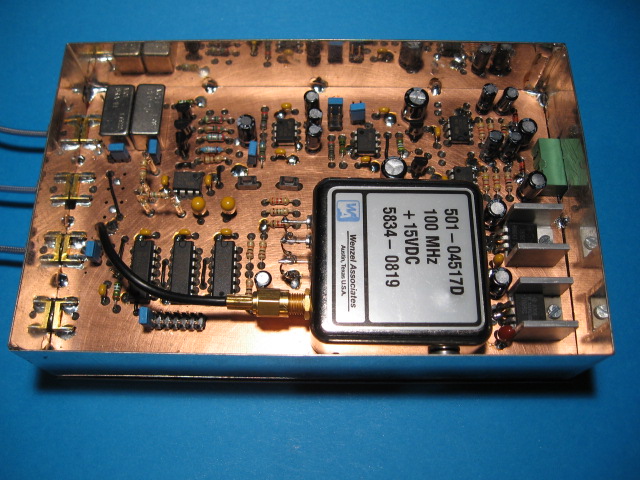
The unit contains:
-
Phase Detector
-
Low Pass Filter
-
LF-LNA
-
Opamp Power Supplies
-
Reference Oscillator
-
Digital Divider
-
PLL Loop Filter
Phase detector
The phase detector / mixer is an SRA-1H+ DBM from Mini-Circuits. This is a 500MHz, +17dBm level DBM, which is driven in this application at +13dBm. With a +13dB LO it will easily handle RF-port signals of 0dBm, or maybe a bit stronger without saturating. Using the beat-note procedure described in the Wenzel library to measure its phase slope or KΦ, the SRA-1H+ driven with 0dBm at the RF port resulted in KΦ=0.16V/rad. KΦ is needed in order to calculate the optimum loop filter and is dependant of the RF-port input level. The DBM's conversion loss is around -5.5dB at 50MHz and below. At 100MHz it is -6dB.
Low Pass Filter
The low pass filter is a PLP-2.5+ 2.5MHz unit from Mini-Circuits chosen for size and convenience. It removes the sum frequency, while not interfering with the PLL loop-filter constants and it passes through the desired difference frequency, φ(t), the PM-noise mixed to the baseband.
Low Frequency LNA
The low noise amplifier follows the Wenzel design with the 2 parallel 2SK369 JFET's. They are obsolete these days and hard to get. In retrospect it would probably have been better to eliminate the JFET low noise stage altogether and use modern 900pV/√Hz wideband opamps instead with similar results.
The simple low pass LC filter in the Wenzel circuit has been eliminated, because the PLP-2.5+ MCL filter is used instead. The filter is terminated with 50Ω. The other change to the original circuit is less gain and more bandwidth. The original Wenzel LNA has 2x 30dB gain with a bandwidth of 100KHz. I have reduced the gain to 2x 20dB, because that is all that is needed given the sensitivity of my analyzer. The intended side-effect is an increased bandwidth of the LNA to at least 500KHz. The following picture shows the transmission plot of the LNA:
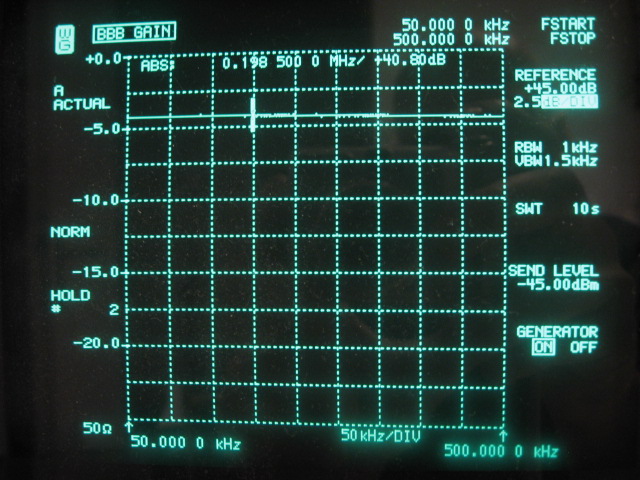
The LNA's seems usable on this picture much further than the displayed 500KHz, at least up to 1MHz, however the noise figure deteriorates beyond 500KHz where it is actually needed most. So I use it only up to 500KHz, which is sufficient.
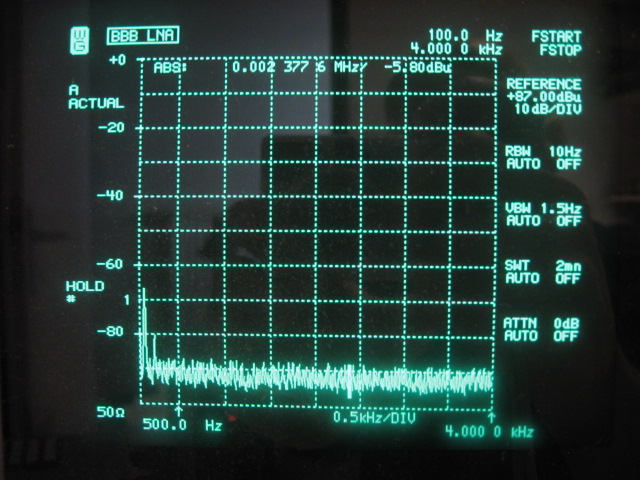
The following picture shows the noise floor of the LNA: -5.8dBμV on the analyzer. The correction factor to convert this to dBμV/√Hz is -54.1dB, resulting in a noise floor of 1.0nV/√Hz in 50Ω. This corresponds to -166.9dBm. That is 4.44dB above the 0.6nV/√Hz claimed in the Wenzel paper. Maybe my 2SK369 JFET's are not quite as good. The LNA's performance however is sufficient for the intended purpose and stays at this level up to 500KHz.
Voltage regulators
The +15V, -15V symmetrical supplies for the opamps consist of ultra-low-noise discrete voltage regulators. The design that has already been used and tested with the 1.8V analog AD9910 DDS power rail. The noise level in this case is 4.5nV/√Hz, corresponding to the input noise voltage of the LM833 opamp used.
Reference oscillator
The reference oscillator is a Premium Sprinter Wenzel oscillator at 100MHz. Its output level is +13dBm and can be jumpered to directly drive the SRA-1H+ mixer. The phase noise performance of this oscillator is described in the 1GHz reference oscillator section. With its tuning pin, the frequency can be pulled 18Hz/V from -5V to +5V, allowing for a total range of 180Hz. The output voltage of active loop filter has been reduced from -15V to +15V into -5V to +5V. So seen from the loop filter it scales down to 6Hz/V which translates into Kv=37.7rad/V
Digital Divider
The purpose of the digital divider is to divide the 100MHz reference clock down by 2, 4, 6, 8, 10, 12, in order to enable PM-noise measurement at sub-harmonics of 100Mhz. The circuit is a synchronous Johnson 6-bit counter constructed with 3x 74AC74. A jumper block is used to set the division rate. Jumpers are also used to select the divider or the Wenzel directly.
Although a synchronous counter is used rather than a ripple through counter, the residual phase noise of this divider is not good enough to evaluate the AD9910 DDS. More on this topic is found the AD9910 PM-noise section.
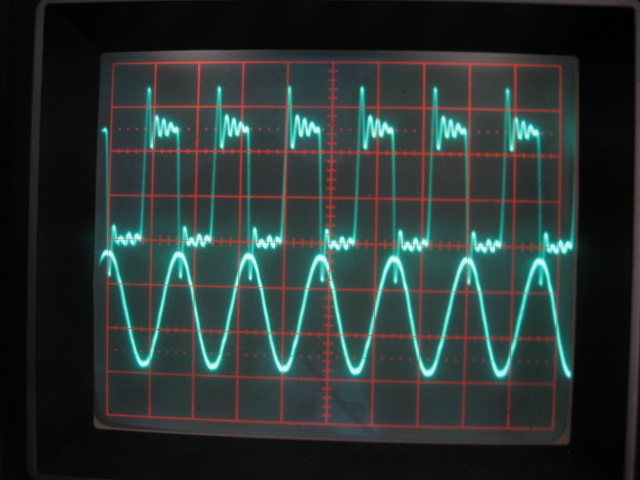
The digital divider drives the DBM LO-port directly through a 50Ω resistor, resulting in +13dBm at the fundamental frequency. The DBM is receiving a square wave at the LO-port rather than a sinus wave. This is not important, because the LO-port is driven in saturation anyway. The following picture shows a quadrature lock with the divider output at 12.5MHz:
PLL Loop Filter
The PLL loop filter is a standard type 2 second order active loop filter, consisting of a single opamp, a gain resistor, a damping resistor and an integrating capacitor. The loop bandwidth should be at least a factor 10 less than the lowest phase noise offset frequency from the carrier to be measured. The reason is that inside the loop bandwidth of the PLL, the reference oscillator will follow the DUT precisely when in lock. This cancels any phase noise inside the loop bandwidth at the output of the phase detector as can be seen in the formulas presented at the top of this page! The loop bandwidth is set at 1Hz to be able to measure reliably as close as 10Hz offset from the carrier. Given the loop bandwidth of 1Hz, a damping ζ=1, KΦ=0.16V/rad and Kv=37.7rad/V the loop filter components can be calculated. The digital divider however further divides Kv, so the gain resistor in the loop filter must be changed depending on the division rate used. Therefore it is made easy to exchange this resistor without soldering. Details on calculating the loop filter can also be found in the Wenzel Public Domain Library
Achieving a lock with a loop bandwidth of only 1Hz is a slow process. Sometimes manual help is needed to get the reference oscillator within capture range. This is accommodated by means of "up" and "down" pushbuttons that push or pull the integrator in the right direction.
Calibration
The PLL method requires a correction factor to translate the values displayed on the spectrum analyzer to dBc/Hz values. The following points have to be taken into account:
-
The spectrum analyzers RBW (resolution bandwidth), must be corrected to 1Hz, when looking at noise. The correction is: -10 * log( RBW ). So -4.8dB for 3Hz, -10dB for 10Hz, -20dB for 100Hz RBW.
-
RBW is usually defined by the -3dB bandwidth of the Gaussian filter curve it represents. This is also the case with my SNA62. When the noise power is integrated over the characteristic shape of a Gaussian filter it will lead to slightly different results than the ideal rectangular filter used normally in noise arithmetic. The correction is: RBWrect = 1.2 * RBWgauss. So the Gaussian shape is perceived by the noise as a slightly wider rectangular shape and the correction factor is -10 * log( 1.2 ) = -0.8dB
-
All spectrum analyzers are calibrated for displaying sinusoidal signals. Therefore a systematic error occurs when displaying noise power. The display of the spectrum analyzer reveals a level that is typically 2.5dB too small. So the correction to be made is +2.5dB.
-
A correction is needed to account for the fact that both the upper and the lower noise sideband are projected into the baseband. The analyzer shows DSB noise rather than SSB noise! Therefore the correction is -3dB.
-
In case it is known that the DUT and the reference have unknown but identical PM-noise performance, then both oscillators will contribute the same amount to the resulting PM-noise. In that case a -3dB correction should be used. Normally the reference oscillator must be better than the DUT and no correction is needed.
-
The gain of the LNA must be taken into account. This correction is -40.8dB up to 200KHz and -40.5 at 500KHz.
-
The level of the carrier that is investigated must be subtracted to arrive at dB's relative to the carrier: dBc/Hz values. The conversion loss of the mixer must be taken into account also. One way to do this is to produce a low frequency beat note by preventing a lock and tuning the DUT close to the reference frequency, for instance with a 1KHz offset. The level of the beat note at the output of the LPF can be measured with an oscilloscope, DVM or spectrum analyzer. Make sure that the LPF remains terminated with exactly 50Ω in order to measure the correct value! Now, calculate the power in dBm of the beat note and add 3dB to obtain the power of the carrier. This takes into account -3dB power that goes to the image and any additional imperfect losses in the DBM. With the AD9910 delivering 0.1dBm into the SRA-1H+ mixer, the power of the 1KHz beat note is -5.3dBm. So the carrier power to correct for is -5.3 + 3 = -2.3dB. With measurements at 100MHz the correction is -2.8dB, because of the extra 0.5dB conversion loss of the DBM.
-
The following correction factor is needed to correct for a systematic calibration error in my spectrum analyzer. The instrument is exactly 5dB optimistic when ranges below 10KHz are swept. Above 10KHz the calibration is correct. This is the first occasion that I used the instrument at such low frequencies and it was quite confusing initially. So below 10KHz the correction is -5dB, above 10KHz it is 0dB.
The total correction factor becomes: Cf = -40.8 - 3 + 2.5 - 0.8 - 10 * log( RBW ) + 2.3, so Cf = -39.8 - 10 * log( RBW ). When sweeping below 10KHz -5dB is added. When measuring at 100MHz, +0.5dB is added. When measuring 2 identical oscillators, -3dB is added.
Given the example where two identical Wenzel Sprinters are used as the DUT and the reference oscillator, the following correction should be applied to arrive at dBc/Hz: Cf = -39.8 - 20 - 3 + 0.5 = -62.3dB. The corresponding picture is:
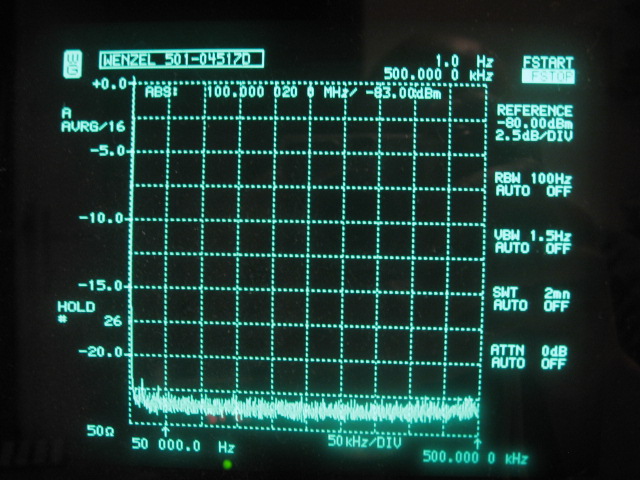
The measured noise floor of the Wenzel OCXO is -166.1dBc/Hz, which is effectively the noise floor of the LNA. At 500KHz offset the slightly deteriorating noise figure of the LNA can be observed. The noise floor comes up with a few tenth of a dB. Only 2 very low energy spurs are visible in this picture. It is not clear if they originate from the OCXO. They are only about 1dB above the noise floor at roughly 20KHz and 40KHz offsets.
Ground Loop Issues
The PLL method is ultra sensitive to ground loops and 50Hz mains related spikes are easily picked up. Measurements close to the thermal noise floor at very low frequencies are prone to this. Furthermore, different subsystems like the PM-noise test set, the 1GHz clock, the AD9910 evaluation board and the spectrum analyzer are connected together with coax and powered with different power supplies. This requires a great deal of attention to ground loops to maintain an unpolluted picture on the analyzer. It turned out that apart from other details, the central grounding point must be the metal box containing the phase noise test set rather than the lab power supply.
Another bad source of pollution is the USB connection between the PC and the AD9910 Evaluation board. With this connection in place, a lot of wideband mains and switched mode PSU related spikes from the PC are introduced in the measurement system!
I even encountered bad noise levels when the different subsystems, making up the measurement setup, where placed directly on the table. The surface is made of "modern" wood finished with a clear protective lacquer. The spikes and noise however disappeared, when the different metal enclosures where isolated from this surface with plastic spacers! Funny enough, I cannot measure any conductivity of this surface with a DVM.
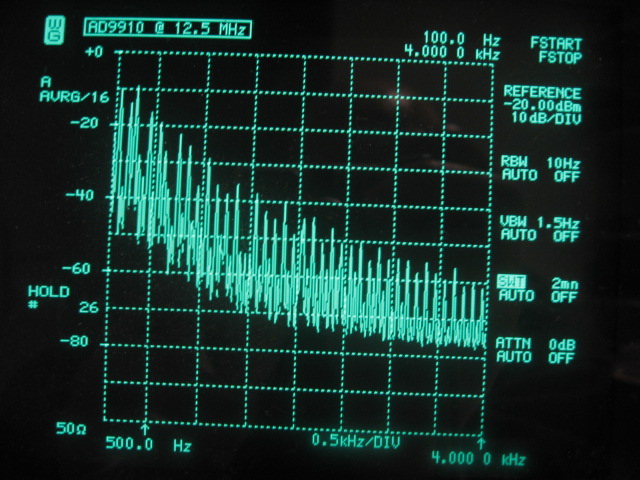
The following picture is a "nice" example of a terribly polluted phase noise measurement of the AD9910 at 12.5MHz. This is before the many different noise contributors in the measurement system were sufficiently reduced.
PLL method pros and cons
The Quadrature Lock or PLL method has the following characteristics:
-
The AM or PM noise of the signal being tested is measured directly.
-
A specialized test set is required.
-
A LF-spectrum analyzer is required. An FFT-software SA with a PC and the soundcard might be a possibility, although I have not investigated that.
-
A reference VCO is needed at the measurement frequency, which outperforms the DUT phase noise wise. Apart from that any measurement frequency is possible within the specs of the DBM. 500MHz with the SRA-H+.
-
10Hz close-in measurements are easily possible! The lower limit of my SA however is 50Hz.
-
Further out measurements are limited by the bandwidth of the LNA. 500KHz with the unit I build. More is not really needed when measuring the AD9910 but it could be improved with more modern very wideband opamps in the LNA.
-
Depending on the type of phase detector used, the method measures either PM-noise or AM-noise. Typically a DBM is used as the phase detector, resulting in a PM-noise only measurement system.
-
Upper and lower noise sidebands are folded into the base band and cannot be measured separately like with the other methods. Unless asymmetric filtering is used, upper and lower noise sidebands are typically identical. Asymmetric filtering can occur for instance in the 1GHz reference clock when the helical filters are not exactly centered at the carrier. This is not much of an issue really, because the helical filter bandwidth is 20MHz, bringing the effect way out of the spectrum that is important to the HF-LO DDS application.
-
The DUT should not be allowed to saturate the RF-Port of the DBM. At 0dBm, saturation is not happening. Given the noise floor of the LNA at -166.9dBm and the IL of the DBM, the practical measurement limit with this configuration is -164.1dBc/Hz at 100MHz. A lower noise LNA together with a higher level DBM and more output from the DUT can improve this. The system as it is however is sufficient to evaluate the AD9910.
-
Also related to the DUT signal level is that the KΦ is proportional to it. This means that when DUT's with different signal levels are measured, it may be needed to reconfigure the PLL loop filter constants to maintain more or less a 1Hz loop bandwidth and ζ=1;
In its homebrew incarnation, the quadrature mixing method requires a huge amount of attention to detail. However, if all those details are sorted out, the result is very good and may even come close to what can be achieved with professional equipment with a stellar price tag, except certainly with regard to ease of use and flexibility.
Quadrature Mixing Variations
Apart from useful variations with the phase detector that allow for selecting either AM-noise or PM-noise, the following interesting variations on the quadrature mixing theme are possible:
-
Single-Channel Absolute measurement system.
-
Cross-Correlation Absolute measurement system.
-
Single-Channel Residual measurement system.
The system described and implemented on this page is the Single Channel version, which performs absolute phase noise measurements. It requires a reference oscillator better than the DUT. This limits the flexibility with regard to the measurement frequency, because a very good reference is needed.
The Cross-Correlation method is also an absolute phase noise measurement system. It uses 2 identical Single channel systems. So 2 PLL's, 2 VCO's and 2 LNA's are needed. The DUT is fed into each channel with a power splitter. The outputs of the 2 channels are analyzed simultaneously using a dual channel FFT. The incoherent noise contributions of both channels are averaged away leaving only the common noise of the DUT. The resulting improvement allows the use of less performing reference oscillators while still maintaining accuracy. This increases flexibility with respect to the reference oscillators and VCO's with a wide tuning range become possible. Therefore the cross-correlation method is often used in today's state of the art SSE's.
Related to the Single-Channel version is the residual measurement version. Residual measurements are used to cancel the effects of reference clocks and power supplies, which can be seen external to the DUT. So only the additive or residual contribution of the DUT itself is measured. This requires a Single Channel system and a single reference clock that clocks 2 identical DUT's such as a DDS or a digital divider through a power splitter. A phase shifter is needed to shift the output of 1 DUT exactly 90°. The 2 signals are now fed into the DBM phase detector and amplified and inspected in the usual way. All contributions of the common power supplies and reference clock are canceled out. An interesting article by David Brandon and John Cavey of Analog devices where the DUT seems to be an AD9910 DDS or similar device can be found here: Residual Phase Noise Measurement Extracts DUT Noise from External Noise Sources
Reciprocal Mixing
Crystal Notch Filter
Quadrature Mixing
Back to Sideband Noise Measurement
Back to the TOC
|